From Fragmentation to 25% Conversion Gain
How centralizing lab equipment purchasing and monitoring drove measurable results
The Why:
Conflict & High Stakes
Beckman Coulter needed to overhaul its e-commerce experience for lab professionals. The existing platform was highly fragmented, lacking intelligent product discovery and a way to monitor vital instrument activity post-purchase. This created intense user frustration and directly impacted business revenue.
Core Issues We Faced:
- Poor Product Discovery: Separate and complex technical systems.
- Disconnected Journey: Multiple purchasing pain points from research to procurement.
- Limited Visibility: Disconnect between purchased equipment and ongoing laboratory operations.
- No Single Source of Truth: Multiple systems for login, instrument performance, maintenance, and analytics.
Access to my instruments & training materials gated vs not. There are too many login authentications. I find it difficult to locate my purchases & training materials.
The Process:
Strategic Alignment & Validation
To address fragmentation, we initiated a 3-Day Kaizen A structured event for continuous improvement with a cross-functional team (including Global Marketing, Development, CX Manager, Content Strategy, and SMEs). Our goal: Organizational alignment on the buying process, creating a definitive User Journey Map, and an early iteration of a Centralized Dashboard.
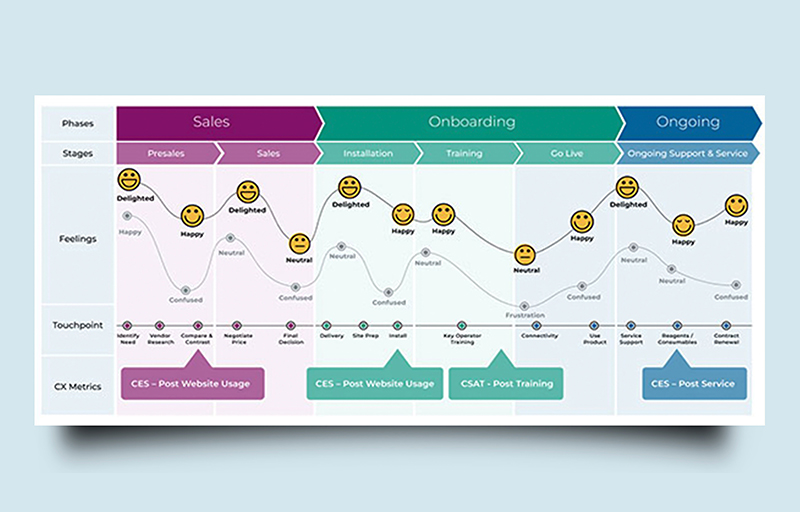 Artifact: The User Journey Map detailing buyer pain points.
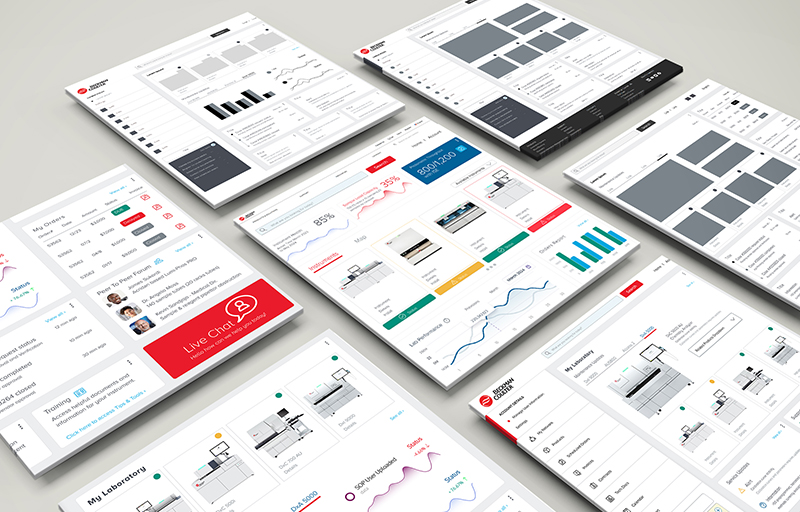 Early Prototype: Visualizing the new dashboard concept.
Key Process:
- Visualization & Research: I created the visualization, participated in user interviews and an affinity mapping exercise, resulting in the User Journey Map, our core strategic artifact that outlined the buying process.
- Data-Driven Design: I led the application of data analytics to identify key persona engagement patterns, informing all design hypotheses.
- Rapid Prototyping: I created the rapid prototype of the new digital portal dashboard in Figma for immediate validation.
- Collaboration: I worked directly with the Development and Tech Support teams to define UI component requirements and constraints.
The Pivot:
Shifting from Historic to Real-Time Monitoring
Our initial designs centered on purchase history. However, user testing revealed a crucial disconnect: Users didn't just need history; they needed support and a central monitoring system for their active lab equipment.
This pivot drove a crucial redesign to introduce dynamic elements (like real-time status). This ensured the final structure solved the core strategic problem and was validated via continuous testing.
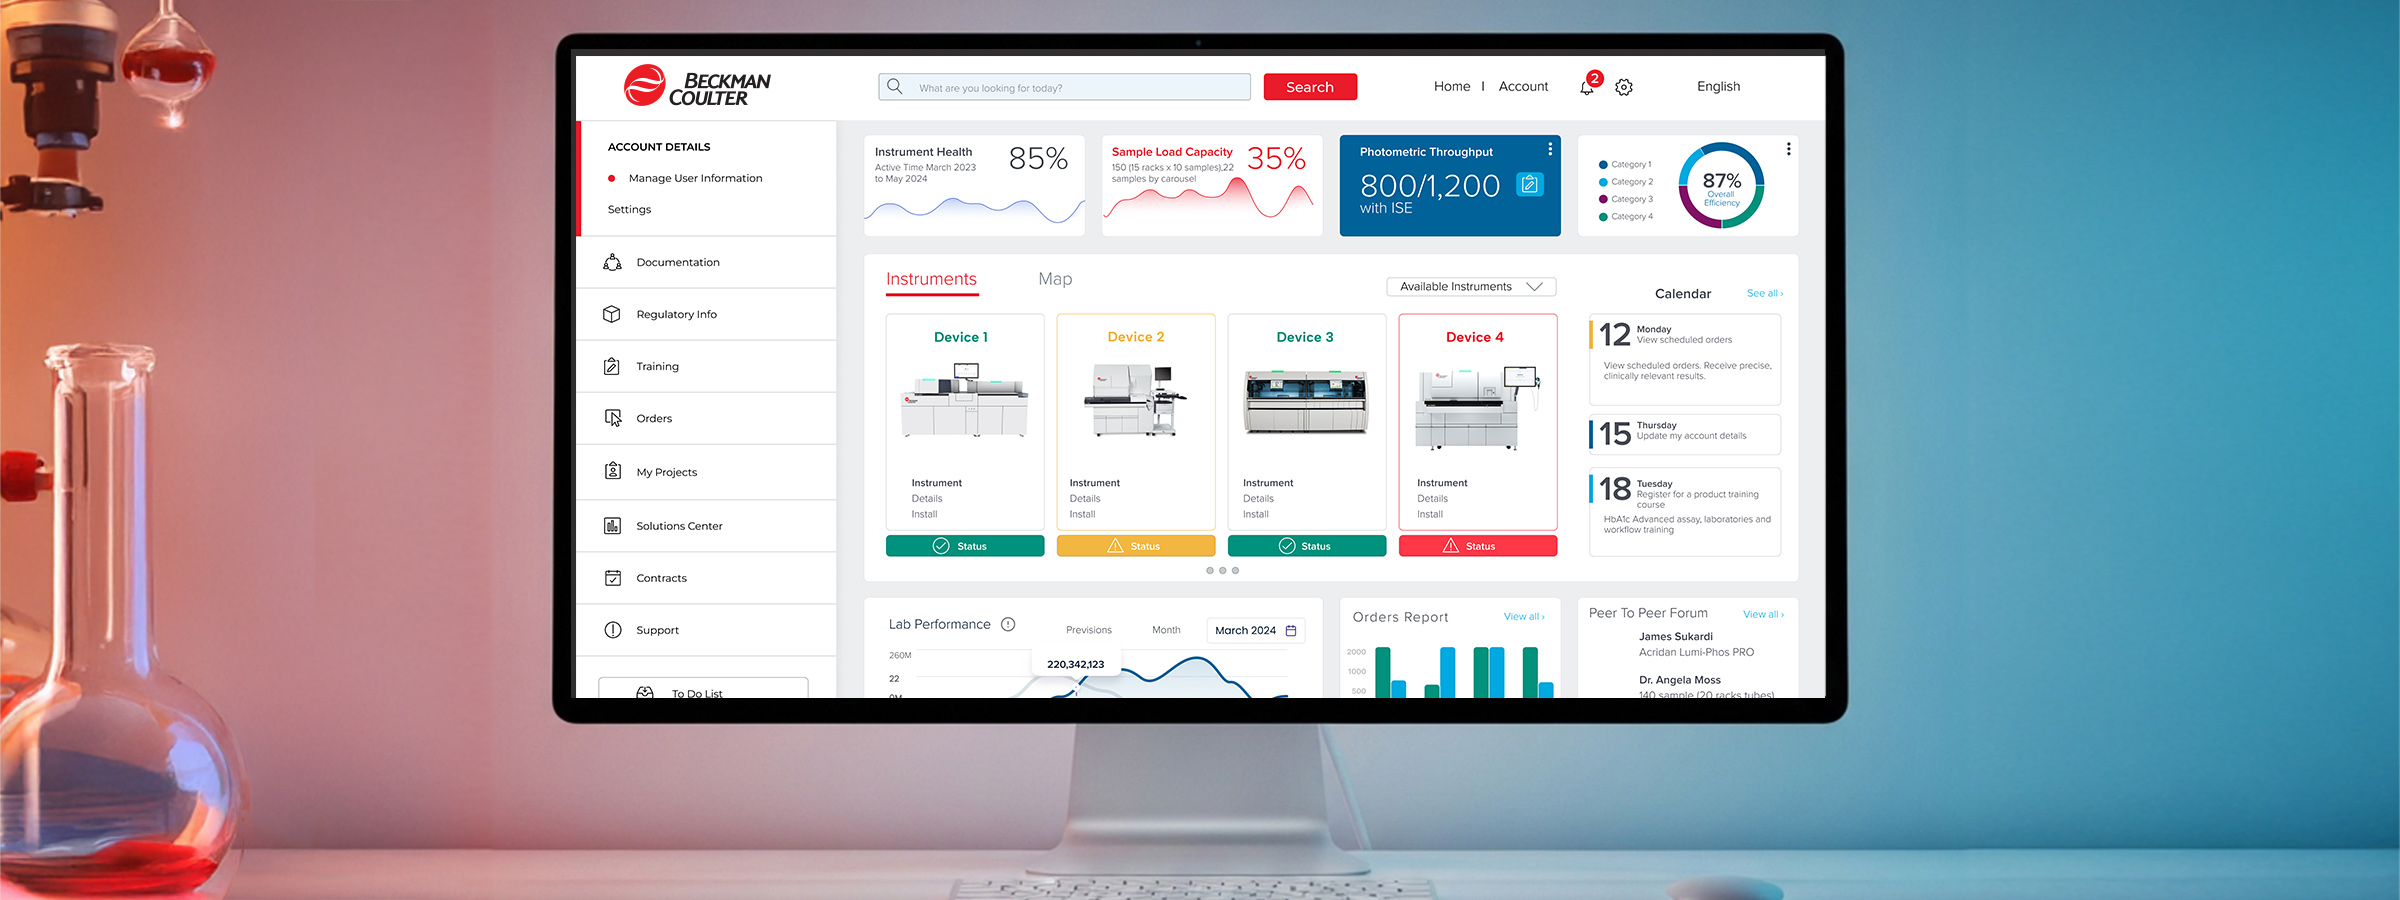
 UI Components: Real-time Instrument monitoring and support sections.
The Outcome:
Measurable Results & Enhanced Experience
The project streamlined customer interaction and centralized the entire instrument lifecycle. User feedback was overwhelmingly positive, confirming the value of the new monitoring dashboard.
Key Features Delivered:
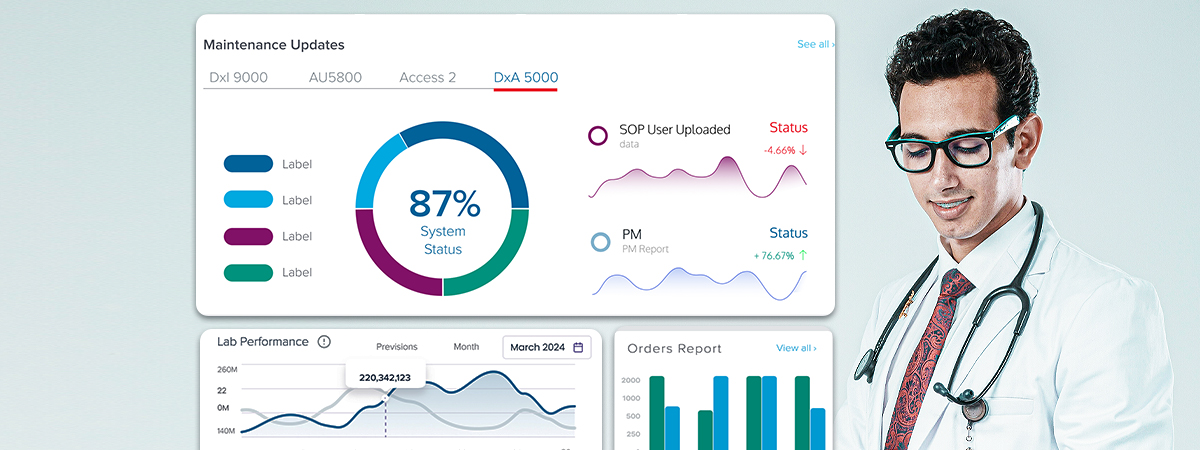
- Real-time instrument status monitoring & performance analytics dashboard.
- Unified dashboard with maintenance scheduling and service history.
- Personalized login experience based on lab type (single sign-on).
- Collaboration Design: Defined UI elements with Tech Support to ensure technical accuracy and usability.
Key Metric:
Business and User Impact
Platform improvements drove a noteworthy 25% increase in conversion rate, translating design success directly into business gains.
Design Insights:
What I Learned
Through this project, I learned that specialized personas function uniquely and differ between laboratories with distinct operational needs, requiring highly customized user experiences. Laboratorians consistently expressed high demand for live chat and connectivity features to access immediate technical support during complex purchasing decisions.
The research also revealed strong user preference for a centralized data dashboard that monitors laboratory operations comprehensively. Additionally, I identified critical low points between the sales and onboarding process that present opportunities for future UX improvements and smoother user transitions.